November 6, 2026
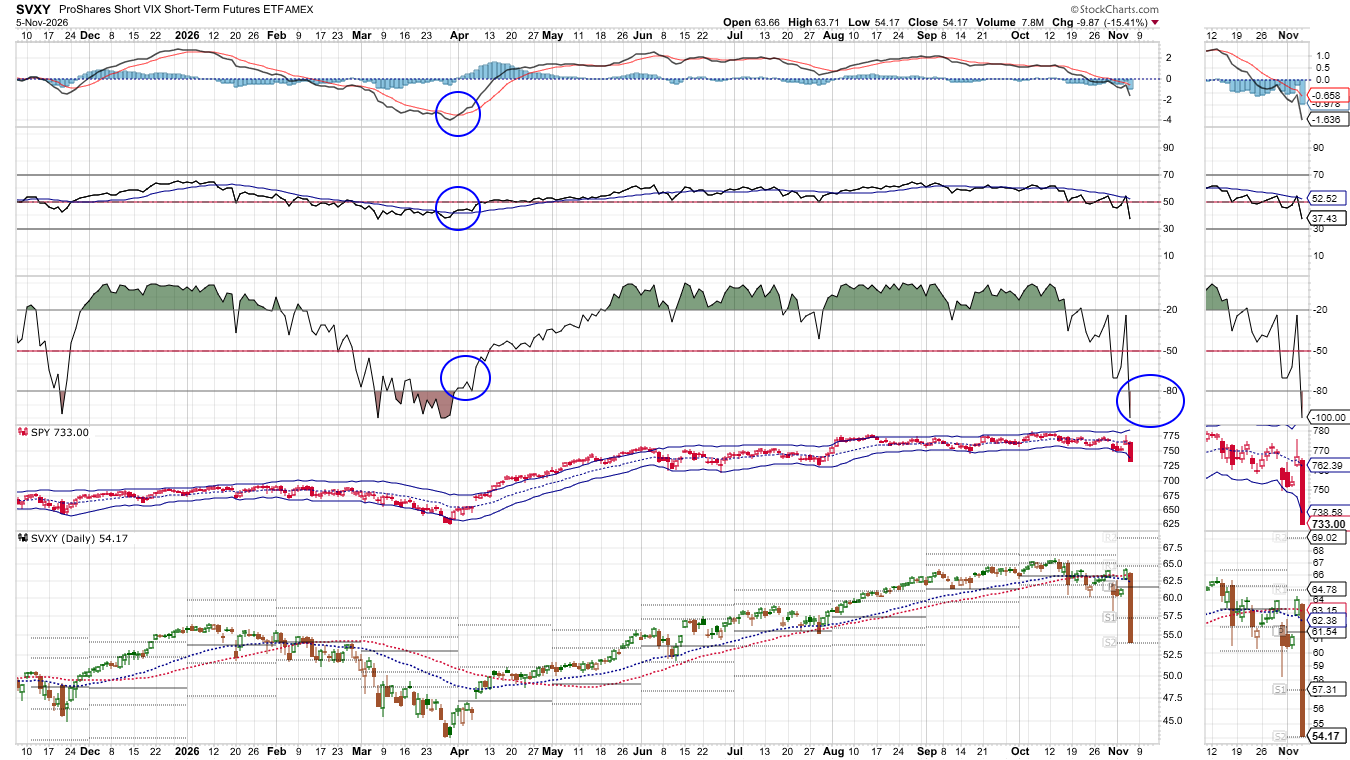
I use SVXY, an inverse VIX ETF, to track our systematic short-volatility harvesting signal, so when volatility spikes, SVXY falls, and Thursday it fell hard. SVXY closed at $54.17 on November 5, down $9.87, or 15.41 percent, on the day, from an open of $63.66, on volume of 7.8 million shares. That is the short volatility side taking the hit as spot VIX jumped 69.66 percent on the day to close at 28.18, the third largest one-day VIX jump since 1990.
The momentum panels on the chart are deeply negative, and they are still falling. The PPO lines sit at about -0.66 and -1.64, RSI is down to about 37.43, and the Williams % indicator sits at -88.97, circled on the chart. That -88.97 is the same kind of extreme we saw in late March and early April. An extreme print can mark a washed-out market, but it is not an all-clear signal by itself. Here momentum is still falling, with no sign of a turn in the PPO or RSI yet.
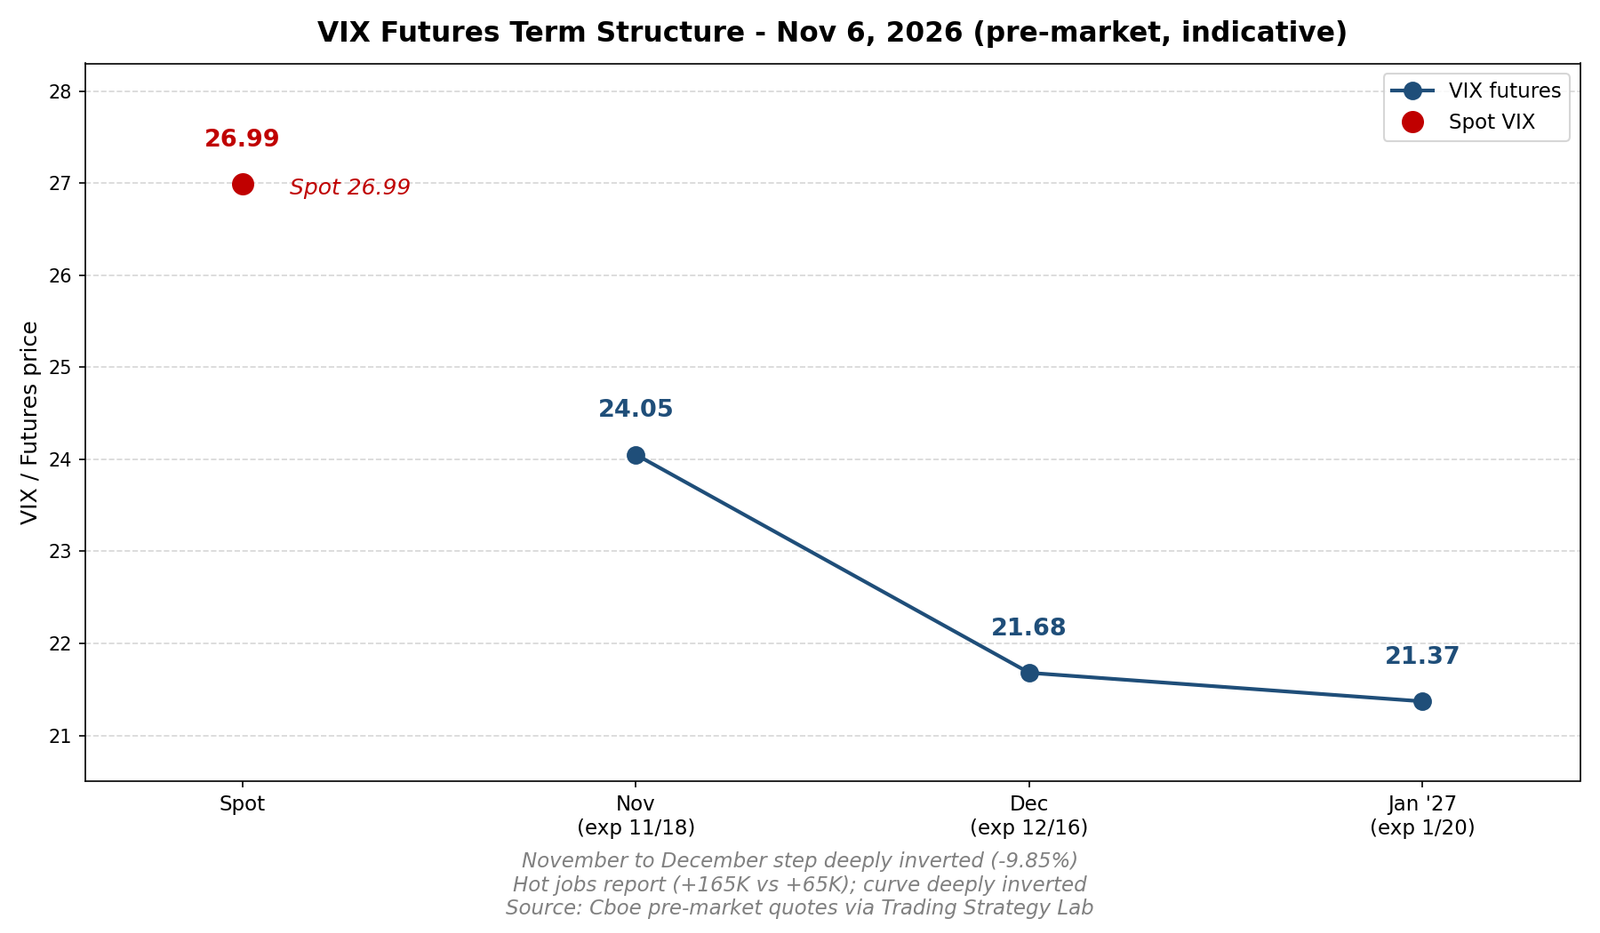
The shape of the VIX curve, the term structure, tells the same story from the market side. M1 is the nearest contract, November, M2 is December, and M3 is January. This morning spot VIX sits at 26.99, down from Thursday’s close of 28.18, but the November contract, M1, sits at 24.05 and the December contract, M2, at 21.68, so December sits 2.37 points below November, a downward step of 9.85 percent from M1 to M2. That is far below the long-term median step of about 6.3 percent. The January contract, M3, sits at 21.37, so the curve slopes down from spot all the way through January, a total drop of 5.62 points from spot. Spot sits 2.94 points above M1, so there is no cushion underneath at all. In plain terms, the market is paying for near-term stress and pricing calmer volatility further out, and an inverted curve is itself the stress signal, not a buying opportunity. When the curve is inverted like this, which is what traders call backwardation, short volatility does not pay you to wait. The front contract sits below spot, so a short position loses as that contract rises toward spot, even if spot itself stays put. There is nothing to harvest here.
Positioning lines up with that read. Dealers ended Thursday in short gamma territory, with net dealer gamma of about -$51.72 billion, which means hedging tends to amplify moves in either direction rather than damp them. The expected daily move for the S&P 500 is understandably elevated at around plus or minus 1.70 percent.
What changes my read: a turn in the SVXY momentum panels, with PPO and RSI turning up along with the Williams % working its way out of deeply oversold levels, and the VIX curve flipping back to an upward slope. Until that shows up, short volatility harvesting stays paused, with no new exposure, and I wait for the turn rather than buying into a tape where dealer hedging amplifies every move.
Educational market analysis only. Not investment advice. See Terms of Use.
Related: Market Regime: A Hot Jobs Report, and the Read Flips Back to RED
Leave a Reply