November 9, 2026
The Thesis
This is a defined-risk downside bet based on the Market Regime flip to RED on November 6, detailed in Market Regime: A Hot Jobs Report, and the Read Flips Back to RED.
The setup: Payrolls rose 165K against 65K expected, unemployment fell to 4.1%, wages rose 0.4%, and a December Fed hike is priced at about 78%.
The plumbing confirms stress: the prompt M1:M2 spread was -6.37% against a +6.3% decade median, dealer gamma was -$86.6B, and the expected daily move was about plus or minus 1.62%. The S&P 500 remains in negative gamma as of Nov 9.
I am not buying shares here. I am buying a cheap, defined-risk bet that XSP falls back toward 720 by Nov 20, and getting paid $331 per unit to take it.
What is XSP?
XSP is the Cboe Mini-SPX, an options contract on the S&P 500 index, not on shares of a stock or an ETF. It is one tenth the size of a standard SPX option: when the S&P 500 is 7,541.80, XSP is 754.18. One point in XSP equals $100, so one XSP option contract controls about $75,418 of index value at 754.18.
XSP options are European style and cash settled, like SPX. They can only be exercised at expiration, so there is no early assignment risk on the short in the money calls, unlike SPY options, which are American style and can be exercised early. At expiration, no shares change hands. The settlement value is one tenth of the official S&P 500 close, and any amount owed is paid in cash. XSP trades on Cboe only.
The Structure
Underlying: XSP (Cboe Mini-SPX, 1/10th of the S&P 500). Current price at fill: 754.18, up 2.24% today. Expiration: Friday, Nov 20, 2026, 11 days.
Per one unit:
- Long 1x Nov 20 705C (SPX 7,050)
- Short 2x Nov 20 720C (SPX 7,200)
- Long 1x Nov 20 740C (SPX 7,400)
That is a broken wing call butterfly: long one 705 call, short two 720 calls, long one 740 call. The lower wing is 15 points, the upper wing is 20 points, so the butterfly is not symmetric, and that asymmetry is what makes the risk to reward work. All three strikes were in the money when I evaluated it on Nov 7, and all three are still in the money now.
Risk and reward, per one unit:
- Net credit: $331
- Max profit: $1,831 at XSP 720
- Max loss: $169 above XSP 740
- Breakeven: below 738.31
Ratios: Max profit to max loss is 10.8 to 1. Net credit to max loss is 1.96 to 1.
Payoff at expiration
Per one unit:
- Below 705: keep the full $331 credit
- At 720: max profit $1,831
- At 738.31: breakeven, $0
- Above 740: max loss -$169, flat
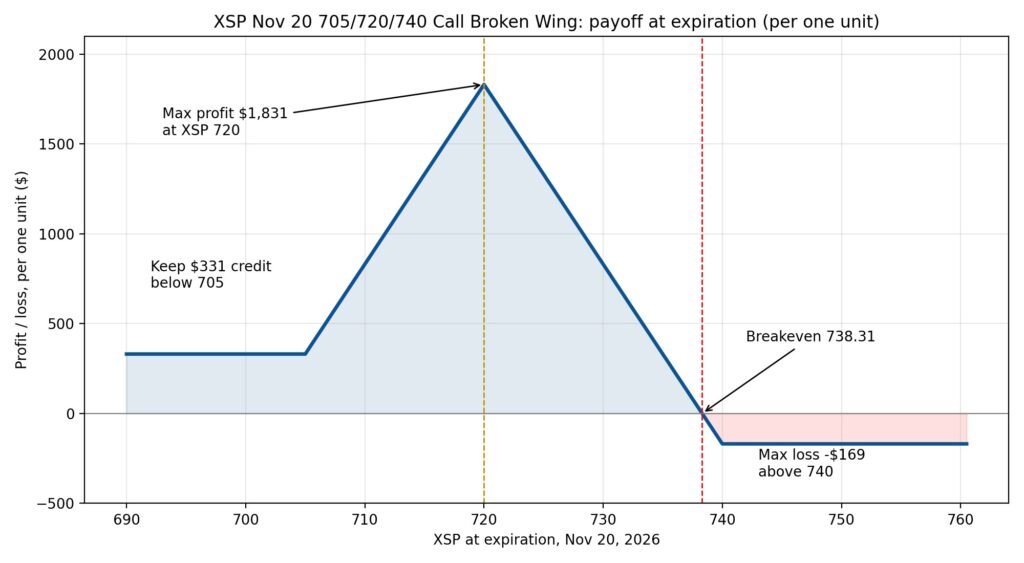
How to read this chart: the blue line is profit or loss at expiration for one unit, against XSP at expiration on the bottom axis. It is flat at $331 on the left, below 705, rises to a peak of $1,831 at 720, the gold dashed line, falls to $0 at 738.31, the red dashed line, and is flat at -$169 on the right, above 740. There is no upside beyond 740, and no downside beyond -$169. That is the whole point of a defined-risk trade.
The Chart Today
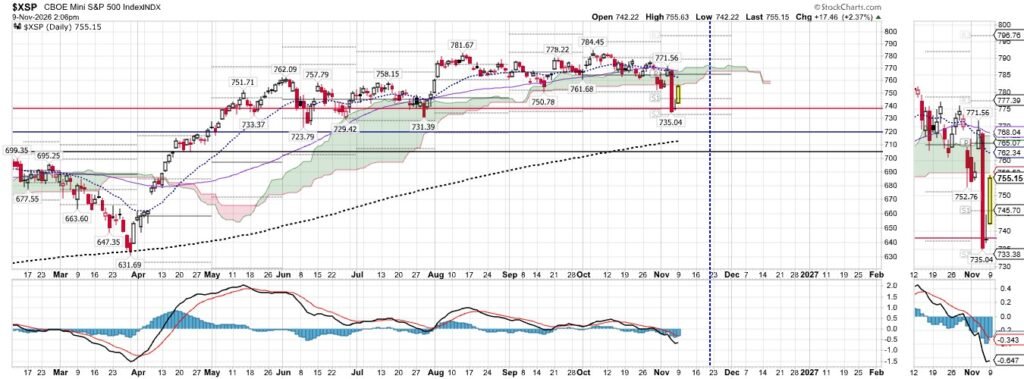
How to read this chart: the top panel is the daily $XSP price from February to November, with candles, and the bottom panel is the PPO momentum indicator. The three horizontal lines across the top panel are the trade itself. The red line is 738.31, my breakeven. The blue line is 720, the short strike and the max profit pin. The black line is 705, the long lower strike, below which I keep the full credit. The vertical blue dashed line is Nov 20, expiration day. The chart also labels S1 at 735.04, just below breakeven, and 752.76, 745.70, and 771.56, which are the next levels up and down.
Nov 9 at 2:06 PM ET: open 742.22, high 755.63, last 755.15, up $17.46, +2.37% from Friday’s 737.69 close. It gapped up and kept going, and it is now $16.84 above my 738.31 breakeven.
Momentum, PPO panel: the PPO sits at about -0.34, above its signal line at about -0.65, but both are still below zero. Momentum is still negative overall, but it is turning up, not down, which matches today’s rally.
Key levels mapped to the trade:
- Resistance: 771.56, the next overhead level
- Support: 752.76 and 745.70, the first levels back down, still above my 740 upper strike
- S1: 735.04, just below breakeven, about $327 profit at expiry per unit
- 729.42: about $889 profit per unit
- 723.79: about $1,452 profit per unit
- 720: max profit $1,831 per unit
That is a 4.6% pullback from 755.15 in 11 days, a lot, but not impossible with CPI tomorrow.
Risks, Plainly
Pin risk: Max profit requires XSP at exactly 720 on Nov 20. A pullback to 735 or 730 is still profitable, just not maximum.
Rally risk: Above 740, I lose $169 per unit. That is the defined loss, and it is already the case at today’s price, though the spread still has time value with 11 days left.
Short window: 11 days. I need XSP below 738.31, a 2.1% fall from 755.15, just to break even at expiry.
Volatility: A vol spike or a sharp rally both hurt, a vol crush helps the short body at 720. The S&P 500 remains in negative gamma, so dealer hedging amplifies moves in either direction.
Settlement: PM close Nov 20, cash settled, no shares. This is a standalone defined-risk downside bet tied to the regime read, not a hedge for a specific holding.
Disclosure
I hold this position as of Nov 9, 2026. All numbers in this post are per one unit. I hold no XSP shares. XSP options settle in cash at expiration.
This log is per one unit in the Derivatives Lab log: $331 credit, $1,831 max profit, $169 max loss, breakeven 738.31, with SPX close on the publication date recorded for comparison.
Educational market analysis only. Not investment advice. See Terms of Use.
Leave a Reply