October 30, 2026
Maintain a cautious approach, as indicated by the Daily Market Regime report. The Technical Index indicator has been a reliable indicator over the past 10 plus years, and right now it is telling a cautious story.
The indicator is the NYSE Technical Index, shown on StockCharts under the proprietary symbol !BINYTI. Its calculation is grounded in market breadth concepts originally formulated by William Mason (“Technical Index Measures Market Breadth”, 1989). It processes advances, declines, up volume, down volume, new highs, and new lows. The exact modern coding details are private, so we focus here on what the indicator shows, not on a formula to replicate.
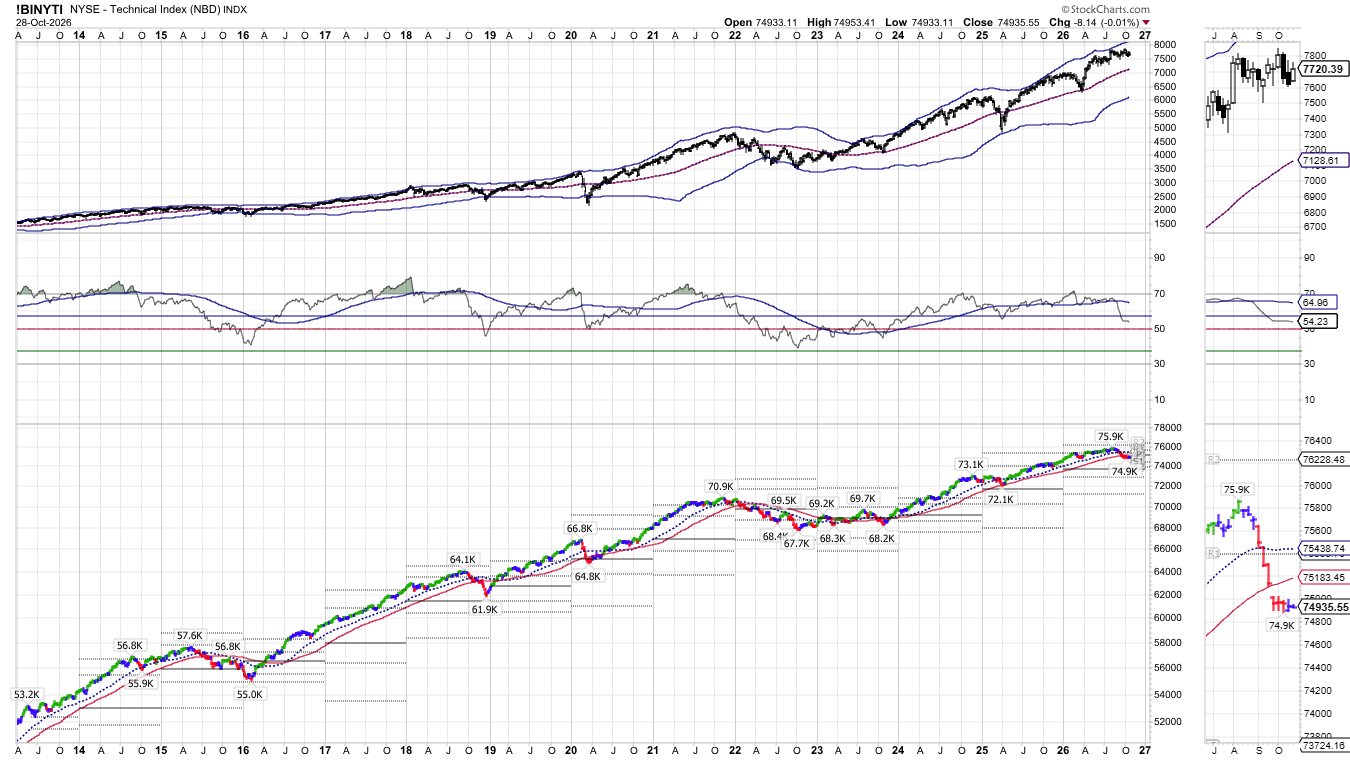
On the chart dated October 28, the top panel is the S&P 500 with Bollinger Bands. Price is still up near the upper band, around 7,720, after pulling back from a higher peak. The middle panel is the breadth oscillator. It has rolled over from around 70 down to about 54, below its own average near 65, and it is drifting toward the 50 line. The bottom panel is the index itself.
That is a divergence story, not a collapse story yet. Price is holding near the top of its band while breadth no longer confirms it. That lines up with a cautious posture rather than a panicked one.
The oscillator at 54 is in no man’s land. It is weak, but it is not washed out. Prior trips toward 50 and below, in 2016, 2020, and 2022, marked real capitulation zones. There is room for it to get worse before it gets better, which supports caution over buying the first dip.
If the past plays out again, we should see the S&P 500 dropping to the lower Bollinger Band, putting it down roughly 20 percent near the 6,100 to 6,500 level. Treat that as a zone to watch for a touch and a reaction, not as a fixed floor. The lower band moves with price, so the level that matters will move too.
What would change the read: the index reclaiming its moving average (blue dotted line) and holding there. Until we see a shift to a positive risk regime, we stay cautious.
Educational market analysis only. Not investment advice. See Terms of Use.
Leave a Reply