October 31, 2026
The week’s economic data told a fairly clean story, and the market mostly ignored it. Growth held up, inflation stayed sticky, and the Fed held rates with a live December hike still on the table. What actually moved stocks this week was not the data at all. It was Thursday and Friday’s tech earnings rout, on worries about AI spending, which took the Nasdaq down 2.00% for the week even as the economy entered the fourth quarter growing, not stalling.
This week’s scorecard:
| Release | Day | Actual | Consensus | Prior | Verdict |
|---|---|---|---|---|---|
| FOMC decision | Wed | Hold, 3.75% to 4.00%, 10-2 vote | Hold | 3.75% to 4.00% | Event, not scored |
| Q3 GDP, advance SAAR | Thu | 3.4% | 3.2% | 2.2% | POSITIVE |
| PCE Price Index, Sep m/m / y/y | Thu | 0.5% / 3.6% | 0.5% / 3.6% | 0.3% / 3.4% | IN-LINE |
| Core PCE Price Index, Sep m/m / y/y | Thu | 0.3% / 3.1% | 0.3% / 3.1% | 0.2% / 3.0% | IN-LINE |
| Employment Cost Index, Q3 q/q | Fri | 0.8% | 0.8% | 0.9% | IN-LINE |
| Durable Goods Orders, Sep m/m | Tue | +1.8% | +1.7% | +0.1% | IN-LINE |
| Durable Goods Orders ex-transport, Sep m/m | Tue | +0.5% | +0.6% | +0.3% | IN-LINE |
| Core Capital Goods Orders, Sep m/m | Tue | +0.5% | n/a | +1.6% | IN-LINE |
| Conference Board Consumer Confidence, Oct | Tue | 91.7 | 80.5 | 84.2 | POSITIVE |
| New Home Sales, Sep SAAR | Tue | 676K | about 650K | 680K (revised) | POSITIVE |
| Initial Jobless Claims, Oct 24 wk | Thu | 194K | about 199K | 195K (revised) | POSITIVE |
| Continuing Jobless Claims, Oct 17 wk | Thu | 1,701K | about 1,720K | 1,722K (revised) | POSITIVE |
| Chicago PMI, Oct | Fri | 55.3 | 56.0 | 58.8 | NEGATIVE |
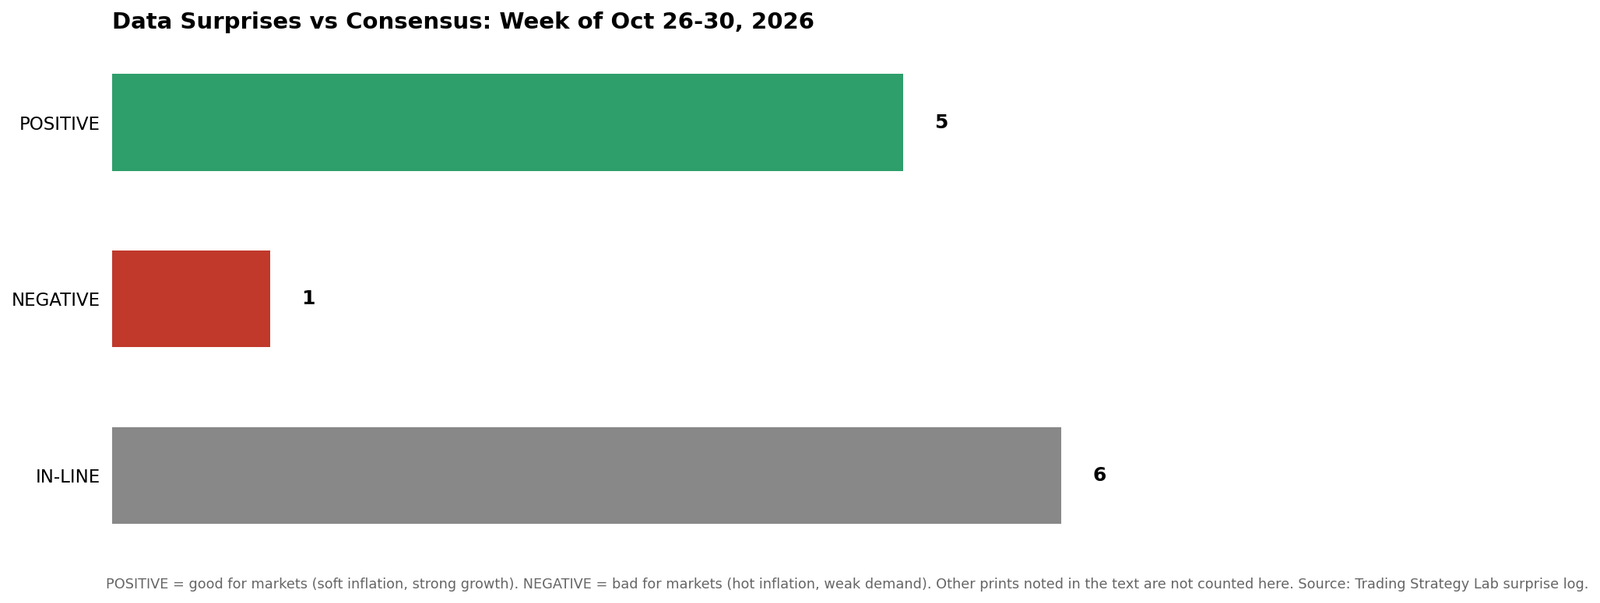
The surprise trend: 5 POSITIVE, 1 NEGATIVE, 6 IN-LINE across 12 scored entries in the table above. The other prints noted below are not counted in that tally.
Other prints this week: Regional Fed surveys, MBA mortgage data, advance trade and inventories, rental vacancy, and August FHFA and Case-Shiller home prices. Together they are second order for GDP and do not change the main read.
Growth held, but the consumer carried less momentum into the fourth quarter. Q3 GDP at 3.4% annualized, up from 2.2% in the second quarter, is the week’s anchor, with real final sales to private domestic purchasers up 4.9%. Durable goods orders (+1.8%, transport led) point the same way. The offset is composition, not direction. Personal spending rose only 0.5% in nominal terms in September and barely rose in real terms, and personal income missed at 0.2%, so the consumer carried less momentum into the fourth quarter than the GDP headline suggests.
Inflation landed in line, and that is not the same as cooling. September PCE landed on consensus, but headline PCE accelerated to 3.6% year over year from 3.4%, core PCE ticked up to 3.1% from 3.0%, and core PCE month over month stepped up to 0.3% from 0.2%. The Employment Cost Index at 0.8% quarter over quarter was in line and a touch softer than the second quarter’s 0.9%, so wage costs are not accelerating, but they are not falling either. Chicago PMI’s prices paid jump to its highest since December 2021 is the week’s quiet hawkish footnote, with respondents citing chemical and petroleum inputs, fuel surcharges, and freight costs.
Labor is a two-speed read, again. Layoffs are not happening: initial claims at 194K and continuing claims down to 1,701K describe a labor market with very low layoffs, even though hiring (September payrolls were just 29K) is soft. That combination, low firing plus slow hiring, is why the labor read is stable, not strong.
Housing is still the softest block. New home sales beat a low consensus at 676K but fell from August’s revised 680K and are down 5.3% year over year, with a median price of $400,400, so volumes are thin. Chicago PMI cooled to 55.3 but stayed in expansion, with employment jumping to its best since April 2021.
Confidence jumped, and it sits oddly next to spending. The Conference Board index jumping to 91.7 from 84.2, with present situation up to 120.4 and expectations up to 72.6, is the week’s biggest sentiment surprise, helped by easing gasoline prices. It sits oddly next to Michigan sentiment near 48, a reminder that the two surveys are measuring different households and different questions, and that confidence has not yet translated into faster real spending.
The Fed path: the Fed held at 3.75% to 4.00% on October 28 in a 10-2 vote, with Gov. Lisa Cook and Cleveland Fed President Beth Hammack dissenting in favor of a 25 basis point hike. A December hike is still priced at roughly seven in ten to four in five, depending on source and snapshot, down from the mid-80s immediately after the October decision. The direction on the week is slightly softer, not a reversal. Warsh gave no forward guidance at the press conference, so December still hinges on the October jobs report and October CPI. For a December hike to be taken off the table, inflation needs to keep cooling, and neither this week’s PCE print nor the nowcasts show that yet.
Markets: the S&P 500 closed Friday at 7,580.07, down 0.57% on the week; the Nasdaq at 25,437.00, down 2.00%; the Dow at 51,770.31, down 0.85%. Monday through Wednesday the tape rallied on the Fed hold and earnings, taking the S&P 500 to a weekly closing high near 7,744 on Wednesday. Thursday and Friday reversed hard on tech earnings and AI spending worries: Alphabet fell about 10% after hours Wednesday, then Intel plunged about 29% Friday in its worst session in decades on a bleak fourth quarter outlook, and the Nasdaq fell 2.86% Friday, its worst day since June. Six of eleven S&P sectors still rose Friday, led by energy, so this was a tech and semiconductor rout more than a broad liquidation. Signal: RISK-OFF for stocks on the week. Bonds: the 10-year fell 6 basis points on the week to 4.94%, the 2-year fell 13 basis points to 4.56%, and the 2s10s spread steepened to +38 basis points from +31 basis points a week earlier. Signal: NEUTRAL, leaning growth scare into Friday, as yields fell on a flight to safety but a 10-year near 4.94% with a December hike still priced at roughly three in four is not a market pricing a Fed pivot.
Volatility curve: Friday closes, spot VIX 19.42, November futures 20.15, December futures 19.60, January futures 20.18. The basis, November minus spot, was only 0.73 points, thin. The front step was inverted, December minus November was minus 0.55 points, or minus 2.73 percent, deeper than Friday morning’s minus 0.94 percent and far below the usual contango of about 6 percent. The whole curve to January was almost flat, only 0.76 points from spot to January. Signal: AMBER (Caution). Spot closed below 20, so the curve, not the spot level alone, is what keeps this amber: near term event risk, the November 3 elections, the November 6 jobs report, and the November 10 CPI report, is priced above the December step, and the thin roll gives short volatility harvesting no help at the front step. VIX spiked intraday Friday to 23.93, a reminder not to read the 19.42 close as calm.
VIX signal guide
| Signal | Volatility | Stocks |
|---|---|---|
| GREEN | Favorable for short-volatility harvesting | Risk-on: deploy cash into new positions, let winners run |
| AMBER | Caution: pause aggressive short-volatility harvesting, tighten risk controls | Caution: tighten stops, trim speculative positions, do not chase on margin |
| RED | Stop: terminate short-volatility exposure | Risk-off: halt new buying, protect principal, move to defensive and cash |
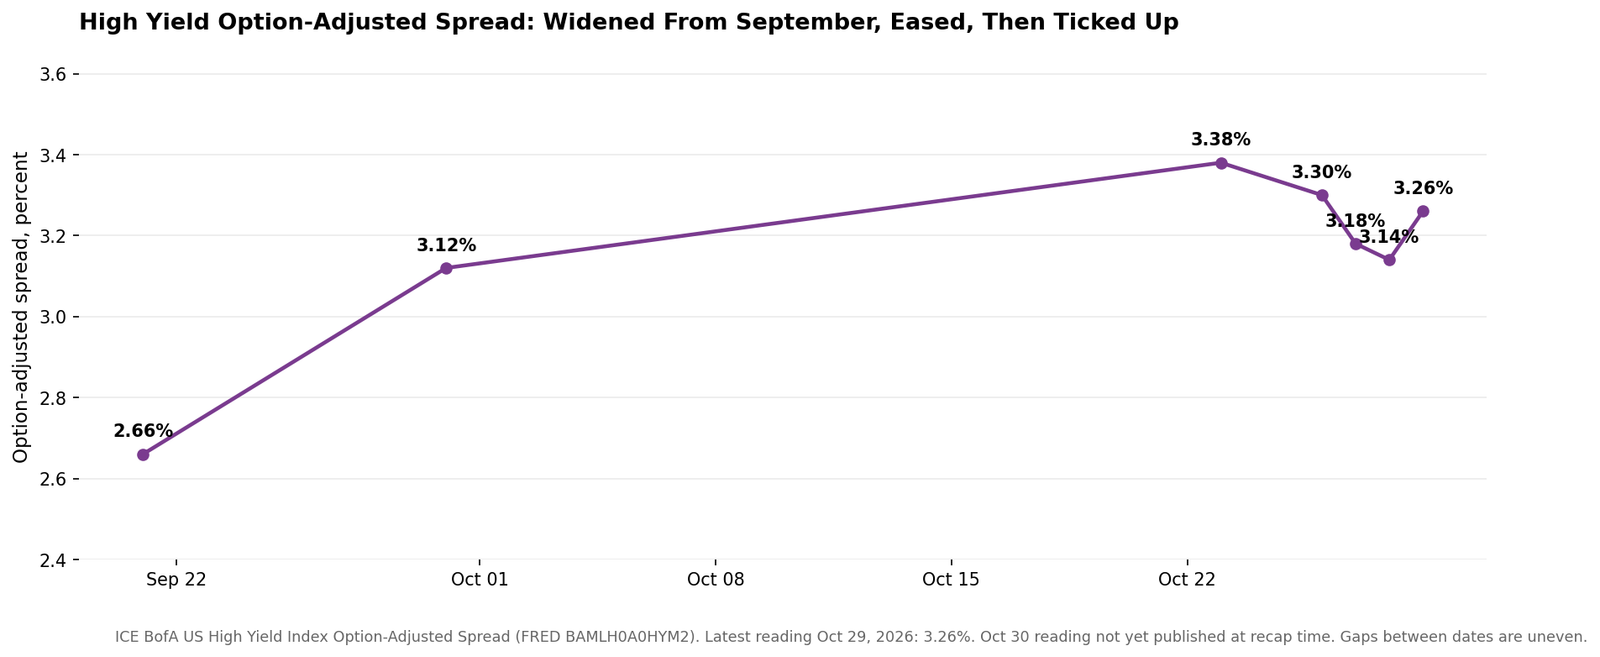
Credit, high yield spread: The ICE BofA US High Yield Index Option-Adjusted Spread, the cleaner spread measure because it strips out Treasury yield moves, was 326 basis points on October 29, the latest reading available at recap time. That was up from 314 basis points on October 28, down from 330 basis points on October 26, and up from 312 basis points on September 30, so spreads widened from September’s tight levels, then eased into midweek before widening again on Thursday. HYG, the iShares high yield ETF you track because it is easy to follow, closed Friday at $77.43, down 0.19% on the day, but up 0.49% on the week in price terms from $77.05 on October 23. HYG mixes Treasury yields with spreads, so its weekly gain partly reflects falling Treasury yields offsetting the spread widening. Signal: NO CREDIT STRESS SIGNAL YET. Spreads widened, but HYG held up on the week and the spread level did not follow the equity rout into a broad credit sell-off. That distinction matters: stocks sold tech, credit did not yet sell credit.
Nowcasts: Atlanta Fed GDPNow finished tracking the third quarter at 3.3%, very close to the 3.4% advance estimate, and the initial fourth quarter estimate opened October 28-29 at 3.2% annualized. That is a strong starting point for the fourth quarter, built on consumer spending and investment, and it will move with next week’s ISM and jobs data. Cleveland Fed’s inflation nowcast puts October headline CPI around 3.75% to 3.77% year over year and October core PCE around 3.13%, both above September’s actuals, and the fourth quarter annualized nowcast as of October 29 runs hotter still, driven by energy. The nowcast therefore leans toward inflation re-accelerating in the fourth quarter, not cooling, which is the main risk to the December hold case.
Next week preview (all ET):
| Day | Release |
|---|---|
| Mon Nov 2 | ISM Manufacturing PMI, Oct, 10:00 AM; Construction Spending, Sep, 10:00 AM |
| Tue Nov 3 | JOLTS Job Openings, Sep, 10:00 AM; Factory Orders, Sep, 10:00 AM; US midterm elections, all day |
| Wed Nov 4 | ADP Employment, Oct, 8:15 AM; ISM Services PMI, Oct, 10:00 AM |
| Thu Nov 5 | Initial Jobless Claims, Oct 31 wk, 8:30 AM |
| Fri Nov 6 | Nonfarm Payrolls, Oct, 8:30 AM; Unemployment Rate, Oct, 8:30 AM; Average Hourly Earnings, Oct, 8:30 AM; Michigan Consumer Sentiment, prelim Nov, 10:00 AM |
Three that matter:
- Friday’s October jobs report. A hot print (payrolls well above about 75K with earnings at or above 0.3% month over month): December hike odds push back toward 85% plus, yields rise, and growth stocks face a second week of pressure. A soft print (payrolls near or below September’s 29K, unemployment ticking up): December hike odds slide toward 50-60%, the hold case strengthens, and bonds rally even if stocks stay shaky on growth worries.
- Wednesday’s ISM Services PMI. A hot print (above 55 with prices paid firm): confirms the services engine is still running hot and keeps the Fed’s inflation worry alive. A soft print (below 50, or a sharp prices paid drop): the first real sign that services, the bulk of the economy, is cooling, and the strongest argument yet for a longer pause.
- Tuesday’s JOLTS openings. A hot print (openings rising toward 7.4 million plus): supports the low layoff, slow hiring story and keeps wage pressure in view. A soft print (openings falling back below 7.0 million): labor demand is loosening faster than claims suggest, which would soften the Fed’s hawkish case ahead of Friday’s payrolls.
What changes the read: Friday’s October jobs report. A hot payrolls and earnings print would re-harden the December hike; a soft print with unemployment above 4.2% would flip the call toward a longer hold.
Educational purposes only. Not investment advice. See Terms of Use.
Leave a Reply