October 19, 2026
This is the first in a series of customized StockCharts setups. Today’s chart is the S&P 500 with one of my favorite timing tools: a momentum indicator (middle panel) with a moving average overlay.
The rule is simple. When the indicator drops below the moving average overlay, the market is going down. When it crosses back above, that’s the buy signal.
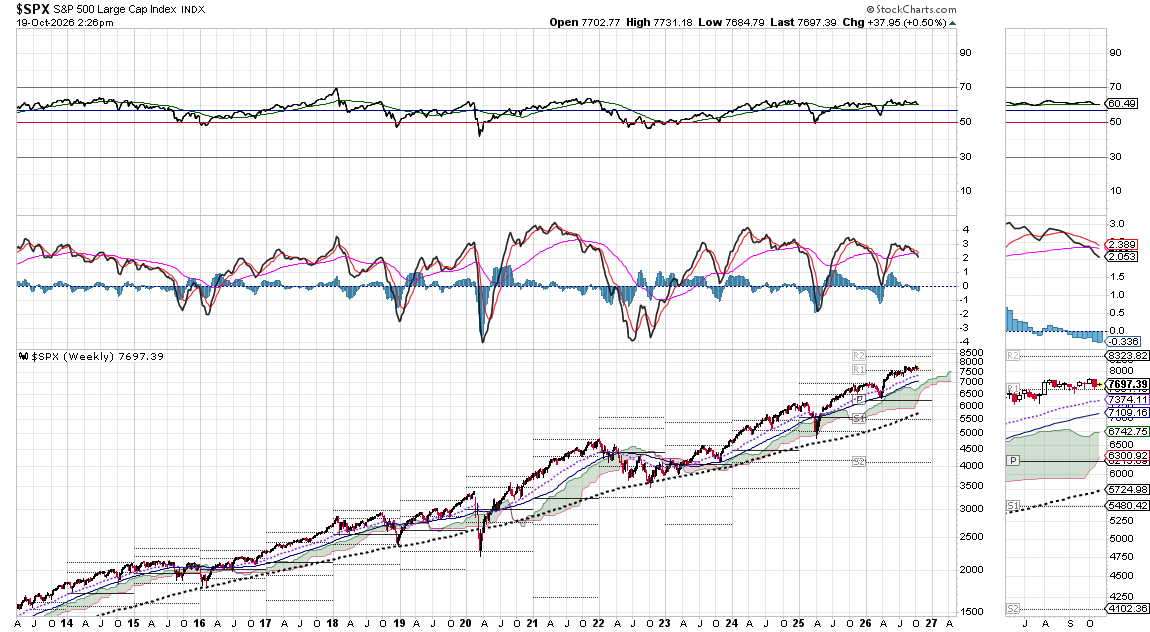
Right now, the indicator sits below its moving average with the histogram flattened out. No buy signal. That means patience: expect more of this pullback before the dip becomes buyable.
This is why I’ve been raising cash over the past few weeks. Cash is a position, and it’s the position that lets you buy the dip instead of enduring it.
How this fits the bigger picture: this morning’s Market Regime read came out AMBER, defensive. VIX has cooled to around 18.6 after Friday’s spike to 20, but the futures curve is flat to inverted, barely upward-sloping up front and backwardated a month out. The options market is pricing almost no premium for short-volatility risk here. That changes Wednesday, when October expiry hands the front contract to November, which holds the October 27-28 FOMC meeting, the PCE inflation report, payrolls, and the midterms, with December pricing roughly 75-78% odds of another rate hike.
Two different toolkits, same conclusion. The regime framework, built from VIX curves, rate curves, and microstructure, describes what kind of market we’re in. The indicator tells me when to act inside it. Right now both say wait: stay defensive, no buy signal, cash ready for the dip.
Educational market analysis only. Not investment advice. See Terms of Use.
Leave a Reply