This morning we published our Equity Intelligence spotlight on Carpenter Technology (CRS) and said the cleaner trade after a 20 percent earnings-day flush was outright accumulation of the shares. The thesis has not changed. The timing of our own buying has: we want the stock, but we want it lower, and today we opened a position that pays us while we wait and sets our purchase price if the flush deepens.
The structure
A put ratio spread, expiring Friday, November 20, 2026, stated per one unit:
- Buy 1 CRS $310 put
- Sell 2 CRS $300 puts
- Net credit received: $1,687
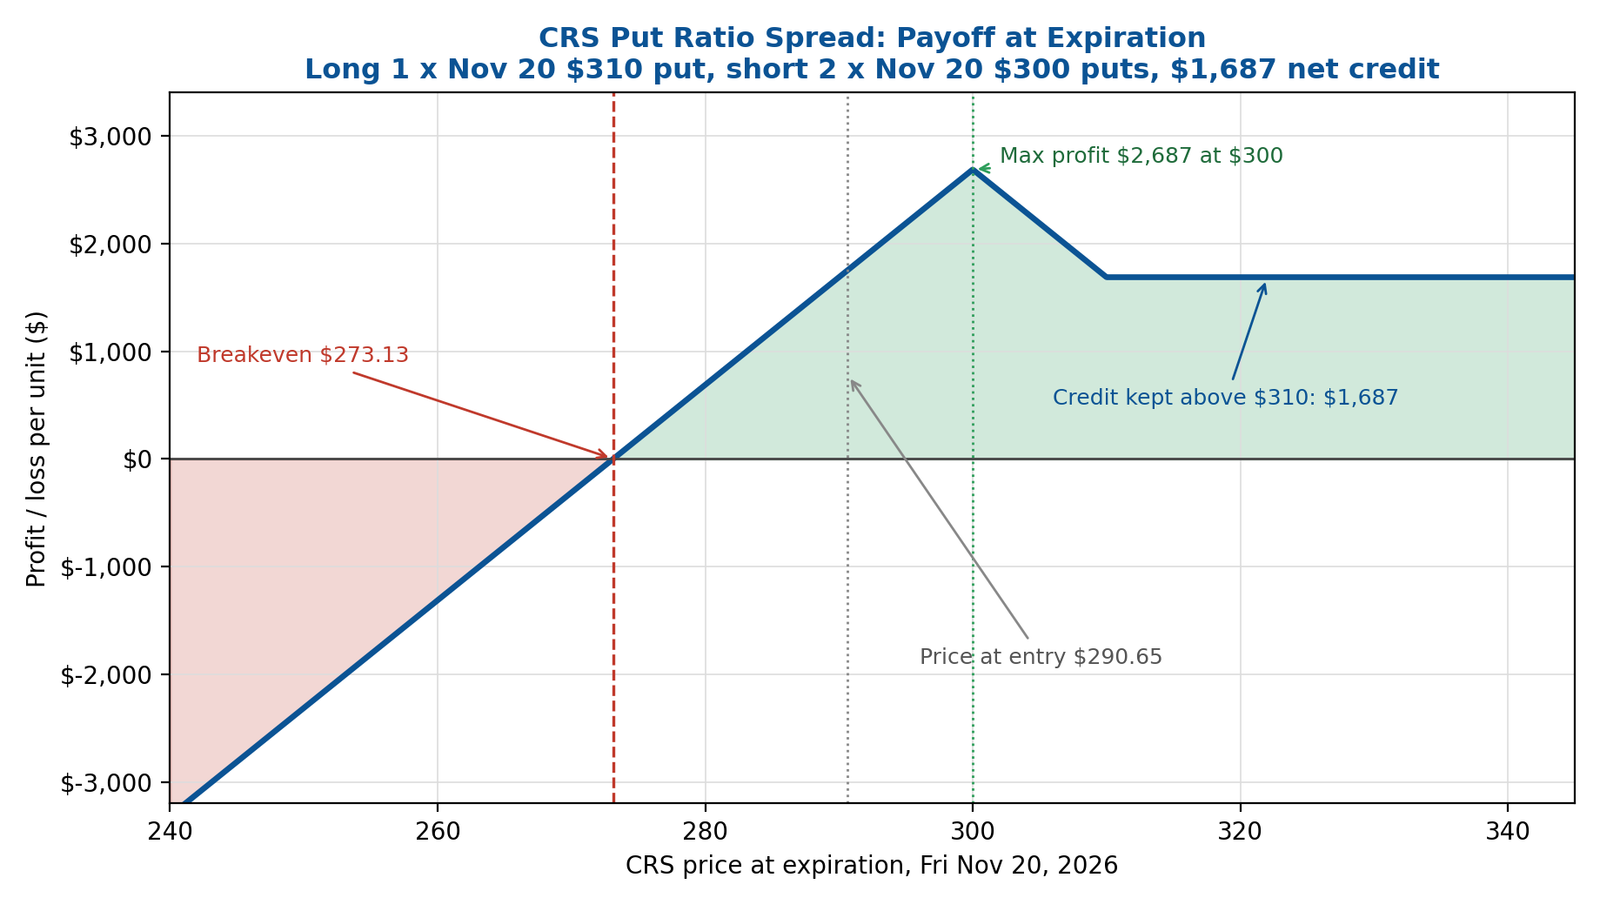
The numbers that matter:
- CRS price when the position was opened: $290.65, down 21.05 percent on the day
- Maximum profit: $2,687, if CRS pins at $300 at expiration
- If CRS recovers above $310, both short puts expire worthless, the long put expires worthless, and we keep the full $1,687 credit
- Downside breakeven at expiration: $273.13
- If CRS is below $300 at expiration and we are assigned, our effective cost on the 100 shares we keep is $273.13, before commissions and fees
- Maximum loss: $27,313 per unit, the theoretical figure if the stock went to zero. That loss is real, and it is why the position is sized as accumulation capital, not speculation capital.
Why this structure, and why now
The fundamental case is the one we laid out this morning, and the earnings call strengthened it:
- The Bear scenario rested on the idea that the record 37.8 percent SAO margin in the fourth quarter was peak cycle. Management’s commentary on order visibility and mix argues against that read for now.
- Pricing power and demand are accelerating, not eroding. Distribution and structural bookings rose 49 percent year over year, and the Aerospace and Defense backlog is at a record.
- The $1.0 billion buyback is running hard: $133.9 million repurchased in the first quarter alone. At $290.65, every dollar of repurchase buys materially more of the company than it did at $367.
- In our read, the 21 percent drop was a positioning event, not a fundamental verdict. The price broke a trendline that momentum traders defend; the business did not break anything.
Put together: the company is executing closest to our Bull scenario ($609), the stock at $290.65 trades like the market is pricing something near our Bear scenario ($250), and our central valuation sits at $468. That gap between price and value is exactly where a put ratio earns its place. We want to be long the business; the structure lets us get paid to name our entry price.
The ratio fits that gap. Implied volatility at entry was about 53 percent, so the puts we are selling carry a rich premium, and the spread leg costs relatively little. Selling two $300 puts against one long $310 put is what creates the tent: maximum profit at the $300 pin, and a defined breakeven far below the current price.
The mechanics of that assignment basis are the beauty of the put ratio for an investor willing to accumulate. If CRS sits at or below $300 at expiration, we are assigned on the two short puts and take 200 shares at $300 each. We then exercise the long $310 put, selling 100 of those shares at $310. The $10 difference on 100 shares is a $1,000 gain against the $30,000 we laid out, which brings the effective cost of those shares to $273.13 each.
Why not just sell the $300 cash-secured put?
The obvious alternative to this trade is the simple one: sell a single November 20 $300 put, cash-secured. We modeled both side by side before choosing, because the comparison is closer than the premiums suggest.
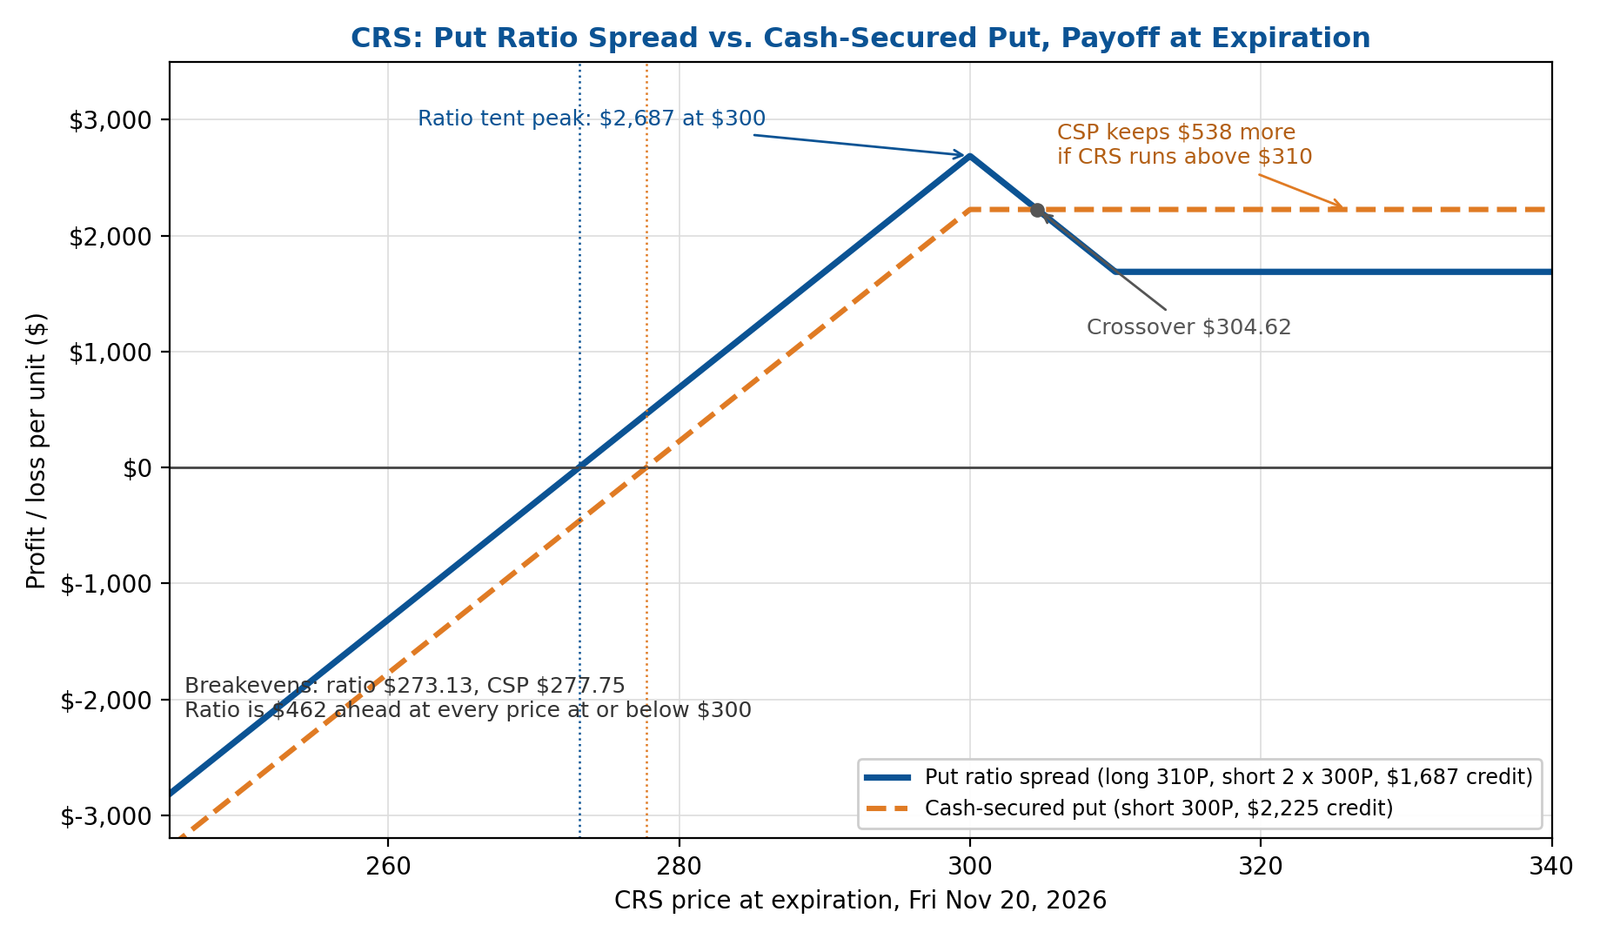
The cash-secured put pays more up front: a $2,225 credit against our ratio’s $1,687, a difference of $538. If CRS simply takes off from here, the put wins outright, because above $310 the ratio keeps only its smaller credit while the cash-secured put keeps the full $2,225.
And yet the put’s assignment basis is worse: $277.75 against the ratio’s $273.13, a gap of $4.62 a share in the ratio’s favor, despite taking in less premium. The reason is the spread leg. The ratio’s long $310 put against one short $300 put is worth its maximum $1,000 at any price at or below $300, and that $1,000 more than replaces the $538 of premium we gave up. Net, the ratio runs exactly $462 ahead of the cash-secured put at every price at or below $300, including at the $300 pin, where the tent in its profit profile peaks at $2,687 against the put’s $2,225, and including its maximum loss, $27,313 against $27,775. The two profiles cross at $304.62; above that, the put’s bigger premium takes over.
So the choice comes down to what the position is for. If the goal were premium income on a stock we merely liked, the cash-secured put is the better tool, and it is simpler: one leg, an easy fill. The ratio has three contracts across two strikes, which can be genuinely hard to fill at a fair price in a less liquid name, and it leaves $538 of premium on the table if the stock rips. Our goal here is different. We want to accumulate CRS, and the ratio accumulates it at the lower overall cost. A $4.62 better basis on a stock we value at $468 is the whole point of the structure, and it is why we lean toward the put ratio for a name we actually want to own.
One note on the comparison: both profiles were modeled Thursday on delayed quotes, and the two snapshots caught the stock a few minutes apart, at $290.65 and $292.27. Compare the shapes and the basis math, not the last few dollars of premium.
The risk, stated plainly
Below $300 at expiration, the position loses $100 per unit for every $1 the stock falls. The reason is mechanical: the vertical spread can gain no more past $300, so the remaining short put carries the downside on its own. That short put is backed by cash set aside in advance, in effect a cash-secured put, so assignment is a planned purchase, not a margin call. At our Bear case price of $250, the loss at expiration would be $2,313 per unit. The maximum loss of $27,313 per unit, at a zero stock price, is the number that must size the position.
Two things keep that risk honest. First, the cash is set aside in advance, so assignment is a planned purchase, not a margin call. Second, the position is small relative to the accumulation capital earmarked for CRS. If the stock halves, we lose money we can afford to lose, and we own a business we want to own.
So the discipline is the same invalidation list as the spotlight itself. We close or restructure this trade if:
- Fiscal 2027 guidance is actually cut, rather than reaffirmed against maintenance timing
- SAO margin starts reverting toward 30 percent
- The buyback is paused or slowed materially while the stock sits at these levels
Absent those, assignment at an effective $273.13 is an outcome we welcome, and we are otherwise content to let the tent do its work into November 20.
What happens next
We will update this post when the position changes: closed, restructured, expired, or assigned. The payoff chart above will be replaced with the realized outcome, and the basis math will be reconciled against actual fills.
Disclosure: John Lah holds the CRS put ratio position described in this post. He does not currently hold CRS shares. Nothing in this post is a recommendation to buy or sell any security.
Educational market analysis only. Not investment advice. Options involve substantial risk, including the possible loss of principal.
Leave a Reply